Wagtail’s 2024 carbon footprint
Measuring Wagtail websites’ footprint so we can reduce it

Two years ago now, we started estimating Wagtail websites’ emissions to report on our project’s footprint and find ways to reduce it. Two years later, the environmental impact of digital infrastructure is as challenging of a topic as ever. We have made progress though, and we have our 2024 footprint numbers now ready to share!
Note: last updated 2026-01-11 based on latest carbon intensity figures for 2024.
Our footprint in one number
6326.87 tons of carbon emissions per year. This is for a sample of 4889 sites, relying on a lot of estimations of those sites’ traffic levels, page weights, and other characteristics. And then from this usage data, estimating energy use.
This is a very complex number to arrive at for a whole site ecosystem, and even more complex to compare it to other years. There are a lot of approximations along the way, but we feel confident this is a useful figure and methodology for us to use to drive reductions in websites’ carbon emissions.
Our footprint in one visualization
One number is neat but it’s not particularly actionable without any context on whether it’s a "good" or "bad" outcome for those websites. So we got up to speed with Digital Carbon Ratings and decided to use those ratings to visualize how the overall ecosystem fares:

This scale shows where Wagtail sites distribute between "A+" low-footprint sites, and "F" high-footprint ones. The way Digital Carbon Ratings grades are set up, 50% of sites should score below "F", and 50% at "F". So our distribution is actually pretty good!
Comparing with the rest of the internet
Here is the same data but compared to how Digital Carbon Ratings were initially conceived. The gray bars correspond to the results for the internet as a whole:

So here we can clearly see which areas we’re doing better than average on (lower "F" scores, higher "A, B, C, D"), and worse than average on (lower "A+"). Wagtail sites tend to be high-traffic and have a lot of content, so we think this is pretty good!
Comparing with 2023
And here compared with 2023! A more challenging comparison as there are a lot of changing variables year-to-year, but still very interesting.
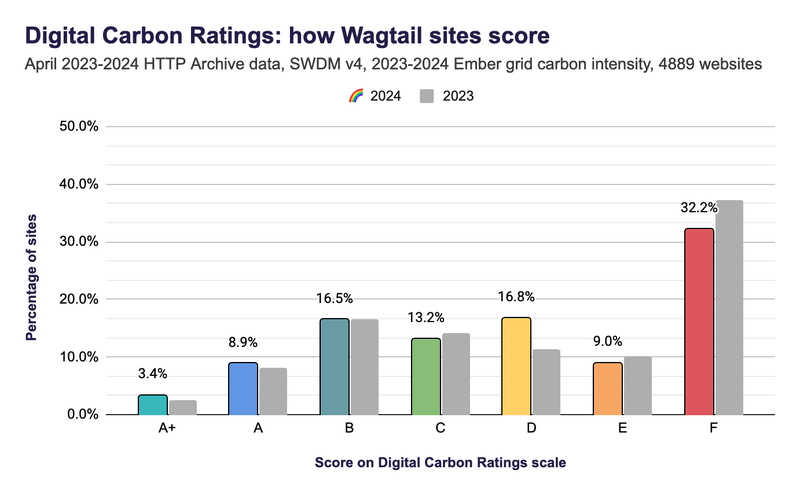
Here are the exact figures for reference:
- A+: 3.4 vs. 2.4%
- A: 8.9 vs. 8.2%
- B: 16.5 vs. 16.6%
- C: 13.2 vs. 14.1%
- D: 16.8 vs. 11.4%
- E: 9.0 vs. 10.1%
- F: 32.2 vs. 37.2%
And comparing total emissions figures in 2023,
- Our total emissions went from 5,198.08 tons of CO2 per year to 6,326.87 tons (+22%)
- This is despite the median page weight going from 1,986 kb to 1,878 kb (-5%)
- And the average carbon intensity has gone down from 422 gCO2e/kWh to 409 (-3%)
The trend on the total is likely because the number of sites went up (+12%), the number of pageviews increased (+19%), and the larger sites’ page weight has increased disproportionally.
Methodology details
Very few software projects report their carbon footprint, let alone "scope 3" footprint. Fewer even consider scope 3 category 11 "Use of Sold Products"! We were encouraged to do this seeing the work of Mozilla, reporting the emissions of the Firefox browser back in 2020. We hope sharing those results, and our methodology details, encourages others to do the same!
Carbon accounting
The overall carbon accounting methodology we want to work within is GHG Protocol, in this specific case Scope 3 guidance. This is a worldwide standard for emissions of organizations of all sizes. It’s not particularly suited to open source projects with contributors and stakeholders from many entities, but it has the advantage to be widely used in companies in the industry.
Website emissions
We evaluated the footprint of a sample of Wagtail websites based on the Sustainable Web Design Model (SWDM) version 4. This uses sites’ data transfer as a proxy for energy use, which is a heavily disputed approach, but has the advantage of being very accessible.
- This emissions total is for 4889 sites from the HTTP Archive dataset. We believe there are closer to 20,000 Wagtail sites out there, but that it’s better to report on exact figures that can be independently reproduced.
- For all sites, based on their domain name, we derive country-specific grid carbon intensity factors from Ember Yearly Electricity data. Using figures from 2024 where available, retrieved as of 2026-01-11. The worldwide CO2 intensity for 2024 is estimated at 471.84 gCO2e/kWh, which we use if the site’s domain name isn’t related to any one country.
- We retrieve the sites’ homepage weights thanks to the same HTTP Archive dataset. This is the approach also taken by the Digital Carbon Ratings, and by the HTTP Archive Web Almanac. In this case we retrieved figures for April 2024.
- We approximate other site pages’ weights by comparing the weight of homepage and secondary pages across a smaller sample of sites, from HTTP Archive data. The ratio we arrived at is for secondary pages to be 67.68% of the homepage weight, and receive 72.53% of the site’s page views.
- We approximate the site’s page views by converting CrUX rankings to pageviews.
A lot of approximations! To get started with similar calculations, we recommend going much simpler, with our Sustainable Web Design emissions calculator as a spreadsheet. This is a simple implementation of SWDMv4 as a spreadsheet, geared towards being easy for multiple people to review in detail.
What’s next
We hope this research will inspire others to do the same calculations for their projects! For us, this has made it possible to quantify and encourage tangible ways to reduce to websites’ emissions, such as our participation to the Green Web Foundation’s grid-aware websites project, and subsequent Google Summer of Code project.
Up next, come join us for Wagtail Space 2025, a free event designed as online-only in big part to have a lower footprint!